Background
I started this piece after reading this piece in the FT which talked about a number of important trends, especially the increased concentration of firms across a wide variety of markets. The graph that caught my eye, however, was the one displaying a measure of the ratio between price and marginal cost, also called the markup, across the different continents for the last 40 years.
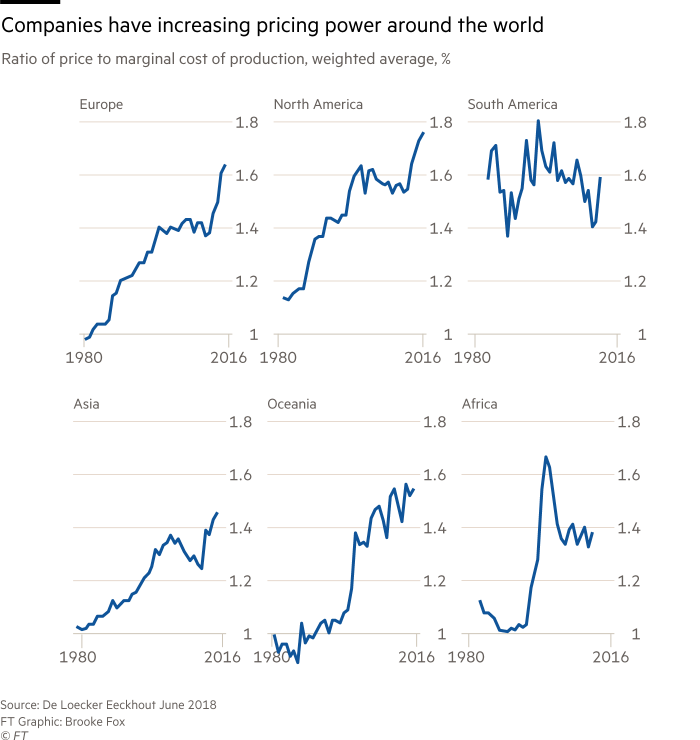
This is a very important result because the identity price = marginal cost is a cornerstone of an efficient market. The basic logic is that if a firm can produce an extra unit of a certain good for less than the price they can sell it for then the creation and sale of that good at should be beneficial to all involved.
This breaks down when a firm occupies a significant share of the market, because when they increase their quantity of goods produced, this creates a meaningful increase in the overall market supply, reducing the price that they receive for selling their goods - not just on these extra new goods produced but on all future units sold, making it beneficial to hold their production down and keeping the market price above marginal cost. When only a few companies dominate a market, we therefore expect this markup to be greater and the market to be less efficient. This rise in the markup, if accurate, is therefore a signal both that our market system is inefficient, and that it is filled companies extracting rents from their dominant position in the market.
There are other factors, including ease of entry to the market, and the way in which firms are competing, which add important nuance to this model. Previous estimates of the markup have used more sophisticated versions of this logic, to estimate the markup indirectly: obtaining values for consumer elasticities, price elasticities, and using a model of the form of competition in the market to estimate the markup which would maximise a company's profit.
De Loecker and Eeckhout
These new markup estimate displayed in the graph come from a paper by de Loecker and Eeckhout who instead introduced a new way of measuring the markup. They looked at the supply side, attempting to directly estimate the marginal cost of production using the Compustat database of publicly traded firms. They use the accounting sum called COGS (Cost of Goods Sold), which should be a measure of the total input into the production, and assuming a Cobb-Douglas production function in which the output is a linear combination of the logs of the inputs, they estimate the output elasticity with respect to variable inputs (ie, if variable inputs rise by 20%, by what percentage will output rise?).
Summary of L&E's methods:
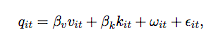
First, the log of the output, q is decomposed into the logs of respectively the variable cost v, the fixed cost k, the technology w(omega) and an error term. The coefficients are estimated by regression, after attempting to correct for a number of biases, and are calculated separately for each industry.
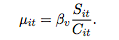
Now the estimate of the elasticiy of output is divided by the fraction of sales that goes into variable cost, or as it appears in this formulation, multiplied by the reciprocal. This gives an estimate for the size of the markup for each firm at each timestep.
Note that although we talk about variable costs, we do not mean that variable costs are the only thing that could be changed in order to make new products, it is just that they are what is changeable in the short term, unlike, say, the level of technology being applied. We expect that if we doubled all inputs, we would be able to double production. Since we can only change variable costs, we ask what percentage of output increase could be generated by a percentage increase in only variable inputs.
Criticism
Marginal Revolution has some criticism here which questions whether their story is consistent with what else we know about the last 35 years, in particular increased levels of international competition from fast-growing countries like China.
Marginal Revolution also brought up the possibility that there may have been an economy-wide increase in fixed costs, such as rents. This will still be sub-optimal in the sense that there are Pareto-improvements possible from transactions, it does not signal such a wide failure in competition as the markup may be what is required However, as Noah Smith finds, there does not seem to exist the large rise in investment that should show up if there is an economy-wide rise in fixed costs.
However, a more serious question is whether the data is secure. Criticism of this approach comes from James Traina who replicated the study but used a different measure of the variable input cost. Overall firm expenditure is divided into capital and expenditure and operating expenditure, with operating expenditure being further divided into cost of the goods sold (COGS, as above) and Selling, General and Administrative Expenses (SGA). Traina repeated the study using SGA instead of COGS to calculate the markup and when this was performed, it was found that markups according to this measure had instead remained roughly constant around 1.15.
If variable costs are mislabelled as fixed costs then the marginal cost of production will be underestimated and so the ratio price to marginal cost will also be underestimated. If, therefore, in recent decades more of the variable costs have been labelled as SGA rather than COGS, the estimate using COGS would show a consistently increasing markup which would not reflect the underlying economic situation, which is what Traina suggests is occurring.
Returning to the formulae above, notice that if it were the case that some elements of the variable cost were consistently omitted from the calculation, this would not be a fatal blow to the calculation because C, the variable cost would be underestimated, but the output elasticity would also be underestimated, likely by an amount of fairly similar magnitude. However, the output elasticity is only a single point estimate that does not change over time, and so if the variable costs are increasingly underestimated, then the markup will be increasingly underestimated, and this is what may be occurring.
The most persuasive element of this explanation is the graph that plots the residual of the share of SGA as a proportion of expenses and finds and extremely strong degree of correlation, suggesting that the explanation for the change is markup is at least tightly linked to the share of SGA. In fact, the correlation in Traina's paper is so close to a perfect linear correlation that it strains credibility and is in need of independent verification which unfortunately requires access to the Compustat database. Assuming, however, that we can trust this relationship, what needs to be understood is the causation involved here. Is the share of costs in this area rising significantly due to reattribution of pre-existing costs to a different part of the balance sheet? Is it instead that firms with greater market power will find it profitable to spend much more on things like sales and excessive administrative pay that causes them to increase their proporttion of SGA?
One possibility is that new internet firms, with high fixed costs, low variable costs and therefore natural economies of scale and high profit margins are dominating the change. This doesn’t seem to be borne out by the data: Traina finds that there doesn’t seem to be an increased level of markup for newer firms on the market, their instead seems to be a weak level of increasing profits when firms age.
Next Steps
To make progress in understanding this issue, the first thing that needs to be done is to understand in more detail why the reported share of SGA as a fraction of operating expenditure has risen - if the source of this increase can be identified this should make it clearer whether this money should be considered variable or fixed cost, and what is driving the shift.
Secondly, more independent reassessments of the data - robustness checks from outside sources - need to be conducted. We currently have two very similar attempts to assess the data leading to wildly different conclusions - who knows what 5 more similar attempts may show. If I am able to obtain access to Compustat I will attempt to be one of these but more would certainly be of use.